Heikin Ashi VolumeHeikin Ashi candles decrease market noise so that broader trends can be more easily visualized. In a typical chart utilizing Heikin Ashi candles, volume bars are colored in such a way that they also allow for the visualization of trends during a bullish/bearish move.
The Heikin Ashi Volume indicator allows the trader to continue to use the same volume bar coloring technique to visualize trends without having to utilize the Heikin Ashi candles, since a Heikin Ashi candle’s OHLC values are not true prices but instead based on calculations in order to provide the ‘denoising’ effect they are known for.
In addition to providing the Heikin Ashi Volume coloring effects, the Heikin Ashi Volume indicator also allows the user to set a volume threshold level where the bar colors will be darker unless volume is beyond that threshold, helping traders quickly determine if there is enough participation in the market at that time to justify taking risk in a trade when the market isn’t very active. The user has the option to show or hide the threshold line, change the colors of the bullish/bearish colors (for both above and below threshold volumes) and the option for the indicator to gradually brighten the bar colors are they approach the threshold instead of having a clear line of demarcation showing volume above or below the set threshold.
스크립트에서 "VOLUME BAR"에 대해 찾기

Volume with High/Low ColoringThe "Volume with High/Low Coloring" indicator is designed to help traders visually differentiate between high, low, and normal volume bars relative to recent historical averages. By applying dynamic color coding and customizable thresholds, this indicator enhances volume analysis and improves your ability to spot key moments of accumulation, distribution, or market inactivity.
High Volume: A bar is marked as high volume when it exceeds the average by a customizable multiplier (default is 1.5×) .
Low Volume: A bar is considered low volume when it falls below the average by another multiplier (default is 0.5×) .
Normal Volume: All bars that fall between the high and low thresholds.
Each category is displayed in a different user-selectable color, providing instant visual feedback for volume dynamics.
Customizable Colors:
High Volume: Light Green (default: semi-transparent green)
Low Volume: Light Blue (default: semi-transparent blue)
Normal Volume: Yellow (default: semi-transparent yellow)
Average Volume Line: Gray (optional reference line)
Modified Volume IndicatorThis indicator colors volume bars based on price and range conditions for a given period:
Green Bars:
The close is at least 70% of the way up the daily range (from the low).
The close is also 1% or more above the low.
Red Bars:
The close is at least 70% of the way down the daily range (from the high).
The close is also 1% or more below the high.
Gray Bars:
Volume bars that don’t meet the above conditions are neutral.
Purpose
Green Bars highlight strong upward closes.
Red Bars indicate weak downward closes.
Gray Bars show neutral or inconclusive price movement.
This indicator helps traders identify momentum shifts and trend strength in real-time.
Auto-magnifier / quantifytools- Overview
Auto-magnifier shows a lower timeframe view of candles and volume bars inside any main timeframe candle by zooming into it. Candles and volume bars as they develop are shown chronologically from left to right. By default, magnifier is triggered when less than 3 candles are visible on the chart.
By default, 20 lower timeframe candles are displayed by splitting main timeframe into 20 parts. The amount of candles displayed is a target rate, meaning the script will use a lower timeframe that has the closest match to 20 candles and therefore will vary a bit. Users can override automatic timeframe calculation and opt in to display any specific lower timeframe or adjust amount of candles shown (e.g. 20 -> 30 candles) per each main timeframe candle.
Example
Main timeframe set to 30 minute, candles displayed set to 20 -> Magnifying using 2 minute candles (30 minute/20 candles = 1.5 min, rounded to 2 min)
Main timeframe set to 30 minute, override set to 5 minutes -> Displaying 5 minute candles
Size of volume bars is calculated using relative volume (volume relative to volume SMA20), lowest bar representing relative volume values of under or equal to 1x the moving average and from there onwards progressively growing.
- Limitations and considerations
Amount of candles shown might flow over from the background on smaller screen sizes, in which case you would want to decrease the amount shown. Opposite is true for bigger screens, this value can be increased as more candles fit.
This indicator involves a lot of tricks with text elements to make it work automatically by zooming in. Size of wicks, bodies and volume bars are calculated by adding more text elements on big candles and less text elements on smaller candles. This means the displayed candles won't be a 100% match, but a rather a fair representation of the view, e.g. candle is green = lower timeframe candle is green, candle has a big wick = lower timeframe candle has a big wick (but not a 100% match).
Example
Magnified lower timeframe chart vs. Actual lower timeframe chart
Most mismatch will be found on the price levels where lower timeframe candles are shown, which is sacrificed for the sake of getting a better readability on the overall shape of lower timeframe price action. Users can alternatively optimize calculations for more accuracy, giving a better representation of the price levels where candles truly originated. This typically comes with the cost of worse readability however.
Example
Optimized for readability vs. Optimized for accuracy
- Visuals
All visual elements are fully customizable.

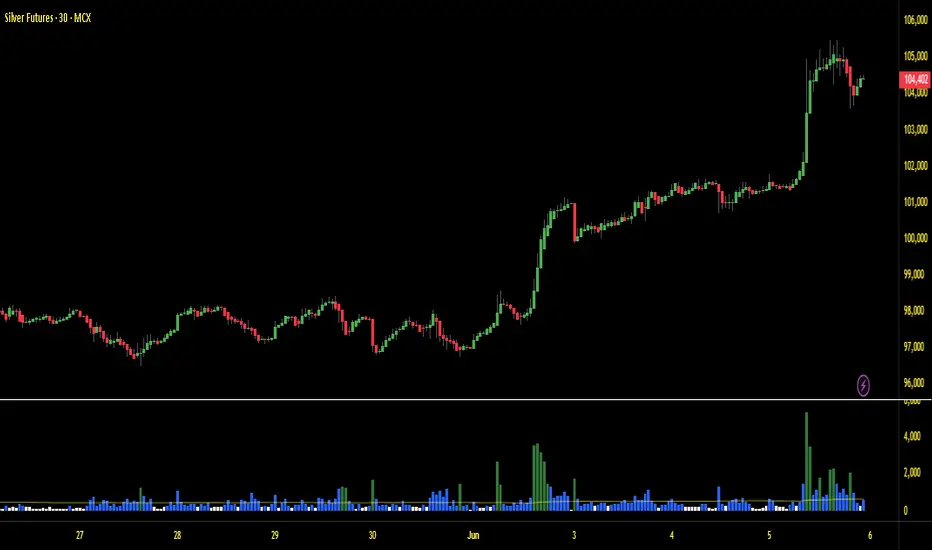
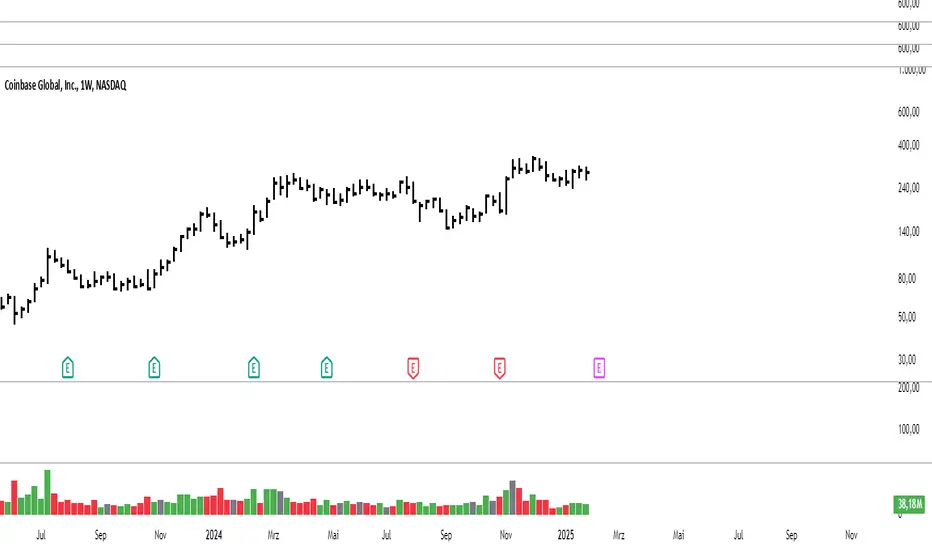
Wyckoff v1.3: Effort vs ResultThis script helps a trader know the actions of smart money - clearly differentiating between valid and in-valid price moves. It is a not script that'll give you buy/sell signals, but in a very Wyckoff way give you the essentials of tape reading of the current chart.
Code Algo: From current candle to previous N candles (N is variable), it calculates a parameter called R = (high-low)/volume; for each candle, hence forming a distribution of R's. Hence, parameter R takes into account the price-volume relationship together, combined which is paramount for Wyckoff reading. Then it calculates mean (M) and standard deviation (sigma) of all those R's. Hence, M denotes the regular price movements expected from a given volume, which will also be a 'valid' move. Then we calculate ranges M-x*sigma and M+x*sigma (where x is a constant) for 3 values of x: 0.5, 1.5 and 2.2. These ranges give us deviations from M, split into 3 different levels. 1st range (E1) is closer to M, 2nd range (E2) is slightly more deviated from M, 3rd range (E3) includes large deviations and 4th range (E4) gives us largest deviations (highest Wyckoff invalidation). Henceforth, we can assess the current candles R value and check which range does it fall into. This gives us the validation degree of this current candle's move in perspective of how the market behaved previously. We assign symbol '+' for this current candle if R>M (hence showing exhaustion) or '-' if R

RVOL + Volume Z-Score (Textbook)This indicator is a relative-volume and “volume anomaly” dashboard designed to help you quickly spot when a ticker is actually in-play versus simply drifting on normal activity. It plots standard volume bars (colored by up/down candles) and overlays multiple optional smoothers of volume (SMA, LSMA/linear-regression MA, HMA, ALMA) so you can see whether participation is expanding or fading across different smoothing styles. It also calculates RVOL (current bar volume divided by the average volume over a user-defined lookback) and displays RVOL (and Z) in a small table for quick reference.
The core feature is a textbook volume z-score: Z=(V−SMA(V,N))/StDev(V,N)
This measures how far the current bar’s volume is from its recent average in standard-deviation units, making it easy to filter for genuinely unusual volume. The script plots mean + 1σ and mean + 2σ threshold bands and can highlight “anomaly” volume bars when Z exceeds your chosen σ thresholds (default 1σ for broader detection, with alerts available for 1σ/2σ). Use it as a participation filter: combine high RVOL / high Z with your price structure (key levels, VWAP, trend) to validate breakouts or identify high-conviction reversal/flush events.

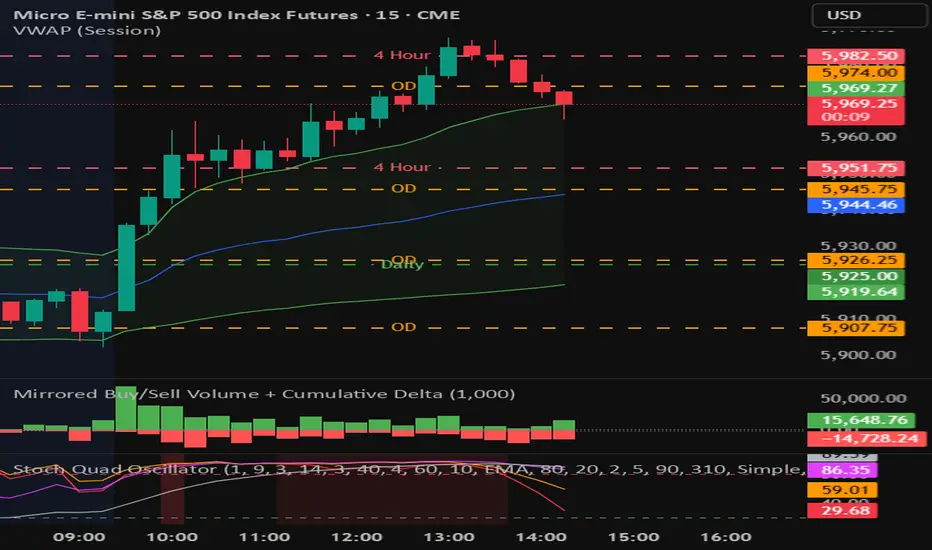
Mirrored Buy/Sell Volume + Cumulative DeltaUser Guide: Mirrored Buy/Sell Volume (Histogram)
🔍 What It Does
Displays green bars above zero for estimated buy volume
Displays red bars below zero for estimated sell volume
Adds a blue line showing Cumulative Delta (buy − sell over time)
Optional threshold lines help spot when net momentum builds up
📊 How Volume is Estimated
Same estimation method as the table version:
Buy Volume is proportion of volume estimated using (close - low) / (high - low)
Sell Volume is remainder of the total volume
Cumulative Delta = running total of (Buy − Sell) volume
This gives you:
A real-time sense of which side is gradually gaining control
More context than looking at candles or volume bars alone
✅ Best For
Visual trade decision support: who’s winning the tug-of-war?
Spotting trend initiation or momentum shifts
Combining with oscillator/trend tools for confirmation
⚠️ Limitations
Still an approximation — not based on actual trade aggressor data
Cannot separate passive vs. aggressive orders
Cumulative Delta does not reset unless specifically coded to do so
May mislead if the bar has long wicks or closes near midpoint
RVOL Effort Matrix💪🏻 RVOL Effort Matrix is a tiered volume framework that translates crowd participation into structure-aware visual zones. Rather than simply flagging spikes, it measures each bar’s volume as a ratio of its historical average and assigns to that effort dynamic tiers, creating a real-time map of conviction , exhaustion , and imbalance —before price even confirms.
⚖️ At its core, the tool builds a histogram of relative volume (RVOL). When enabled, a second layer overlays directional effort by estimating buy vs sell volume using candle body logic. If the candle closes higher, green (buy) volume dominates. If it closes lower, red (sell) volume leads. These components are stacked proportionally and inset beneath a colored cap line—a small but powerful layer that maintains visibility of the true effort tier even when split bars are active. The cap matches the original zone color, preserving context at all times.
Coloration communicates rhythm, tempo, and potential turning points:
• 🔴 = structurally weak effort, i.e. failed moves, fake-outs or trend exhaustion
• 🟡 = neutral volume, as seen in consolidations or pullbacks
• 🟢 = genuine commitment, good for continuation, breakout filters, or early rotation signals
• 🟣 = explosive volume signaling either climax or institutional entry—beware!
Background shading (optional) mirrors these zones across the pane for structural scanning at a glance. Volume bars can be toggled between full-stack mode or clean column view. Every layer is modular—built for composability with tools like ZVOL or OBVX Conviction Bias.
🧐 Ideal Use-Cases:
• 🕰 HTF bias anchoring → LTF execution
• 🧭 Identifying when structure is being driven by real crowd pressure
• 🚫 Fading green/fuchsia bars that fail to break structure
• ✅ Riding green/fuchsia follow-through in directional moves
🍷 Recommended Pairings:
• ZVOL for statistically significant volume anomaly detection
• OBVX Conviction Bias ↔️ for directional confirmation of effort zones
• SUPeR TReND 2.718 for structure-congruent entry filtering
• ATR Turbulence Ribbon to distinguish expansion pressure from churn
🥁 RVOL Effort Matrix is all about seeing—how much pressure is behind a move, whether that pressure is sustainable, and whether the crowd is aligned with price. It's volume, but readable. It’s structure, but dynamic. It’s the difference between obeying noise and trading to the beat of the market.

Slippage Calculator Hello everyone,
This is the first script I publish, also my English is not the best my apologies.
This simple study script is an attempt to estimate the slippage during a trade. By no means it is a precise calculation, it is just an approach that can be improved.
You are welcome to take this simple script and use it and change it at your convenience just ask your acknowledge.
My approach considers the total fluctuation the price gets as a consequence for the total volume on that specific bar.
The volume on each bar is given in BTC, thus you get that by using the formula.
vol = volume * vwap
The total variation in price is considered as twice the size of the bar plus the gap between to consecutive bars. that is the
total fluctuation of price on each bar = (2 * (high - low) + abs(open - close )) which is not totally true since inside each bar price can fluctuate a lot more.
The script considers you are trading your total equity (eq_BTC ) each time. The fraction of your equity of the volume bar is eq_BTC / vol
Then eq_BTC / vol is the portion or the total fluctuation in price that is due to your entry or exit from the market.
(2 * (high - low) + abs(open - close )) * eq_BTC / vol
is the average change in price due you enter o exit a position.
** the 2 factor accounts for the two directions in the market buying and selling. There is more behind this formula I can explain you in more detail if you like.
I haven't seen anywhere a formula like this one, so it is intended to be a first attempt to get a better approach.
Finally the output of the scripts is how many ticks the price might change due to your trade on each bar
round(slippage/syminfo.mintick)
The script is focused in crypto but it can be used as well on forex markets.
Take care,
@yvponce

HVPro Style IndicatorHVPro Style Indicator – Historical Volatility + Volume
HVPro Style Indicator is a combined volatility-and-volume tool designed to help traders visualize market expansion and contraction phases.
It calculates Historical Volatility (HV) using log-returns and a customizable lookback period, then smooths the result for a cleaner trend signal.
The script also includes a volume histogram, scaled by a multiplier, with bar colors changing based on whether volatility is rising or falling.
This makes it easy to spot moments when both volume and volatility align, often signaling trend transitions, breakouts, or exhaustion.
Features
✔ Historical Volatility calculation (annualized)
✔ Smoothed HV for cleaner visual trends
✔ Volume histogram with customizable multiplier
✔ Volume bar color shifts based on HV direction
✔ User-controlled visibility for both HV and volume
✔ Lightweight and optimized for all timeframes
How to Use
Rising HV (green volume bars) can indicate trend expansion or breakout momentum.
Falling HV (red bars) suggests contraction, ranging conditions, or volatility cooldown.
Watch for volatility shifts combined with volume spikes for potential trade entries.

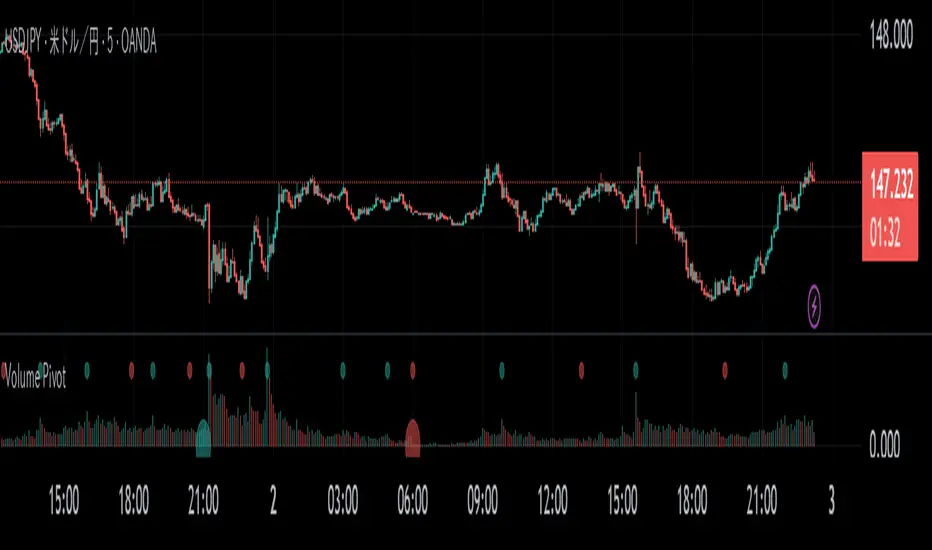
Volume PivotOVERVIEW
Volume Pivot is a technical analysis tool for TradingView designed to identify key turning points in the market by focusing on volume rather than price. It detects peaks and troughs (pivots) in trading volume to pinpoint moments of maximum market interest or exhaustion.
This indicator performs its analysis on both the Current Timeframe (CTF) and a user-defined Higher Timeframe (HTF). This dual-perspective approach allows traders to simultaneously grasp short-term market reactions and long-term structural shifts, leading to more informed and high-conviction trading decisions.
FEATURES
Automatic Pivot Detection
Automatically identifies and plots Volume Pivot Highs (peaks) and Pivot Lows (troughs) based on a user-defined Lookback Length.
Dual Timeframe Display
- CTF Signals : Plotted as tiny circles directly above the corresponding volume bars for immediate, short-term context.
- HTF Signals : Plotted as slightly larger circles at the bottom of the indicator pane, making them easy to distinguish as signals of higher significance.
Flexible HTF Configuration
Customize which higher timeframe to use for analysis based on your current chart timeframe. For example, you can set the indicator to reference the 1-hour chart as the HTF when you are on the 5-minute chart, and the Daily chart as the HTF when you are on the 1-hour chart.
Intuitive Volume Bars
The volume bars are color-coded to show whether volume is increasing (bullish color) or decreasing (bearish color) compared to the previous bar, offering a quick visual gauge of market momentum.
Full Customization
Easily toggle the visibility of CTF and HTF signals and customize the colors for bullish and bearish pivots to match your charting preferences.
Volume Surge Detector[SpeculationLab]Volume Surge Detector
This tool is especially useful for spotting early signs of breakouts, news-driven spikes, or institutional activity that are often preceded by abnormal surges in volume.
For better chart readability, the volume bar colors are based on TradingView’s original Volume indicator, while all other code is fully original by Speculation Lab.
You can customize both the SMA line and the volume bar colors to fit your style.
The logic compares the current volume against its SMA (default length: 14, fully adjustable).
The script comes with two surge levels:
Surge Level 1 (default = 5) → When volume is more than 5× the SMA, the bar turns aqua.
Surge Level 2 (default = 10) → When volume is more than 10× the SMA, the bar turns yellow.
It also includes built-in alerts, so you’ll be notified instantly whenever a surge is detected.
This makes it easier to spot potential breakout moves or large market participation in real time.
Disclaimer: This script is for educational purposes only. It does not provide financial advice.
这是一个用于探测 成交量爆发 的指标。
为了图表美观,成交量柱的颜色借鉴了 TradingView 原始 Volume 指标,其余代码均为 Speculation Lab 原创。
用户可以自由调整成交量柱和其对应的 SMA 均线的颜色。
指标通过对比成交量和其 SMA(默认长度为14,可自定义长度和颜色)的比例来检测放量。
默认设置了两个放量级别:
Surge Level 1(默认=5):当成交量超过均量的 5 倍时,量柱变为水蓝色。
Surge Level 2(默认=10):当成交量超过均量的 10 倍时,量柱变为黄色。
脚本还设置了 内置警报功能,方便交易者在出现放量时实时收到通知。

Volume pressure by GSK-VIZAG-AP-INDIA🔍 Volume Pressure by GSK-VIZAG-AP-INDIA
🧠 Overview
“Volume Pressure” is a multi-timeframe, real-time table-based volume analysis tool designed to give traders a clear and immediate view of buying and selling pressure across custom-selected timeframes. By breaking down buy volume, sell volume, total volume, and their percentages, this indicator helps traders identify demand/supply imbalances and volume momentum in the market.
🎯 Purpose / Trading Use Case
This indicator is ideal for intraday and short-term traders who want to:
Spot aggressive buying or selling activity
Track volume dynamics across multiple timeframes *1 min time frame will give best results*
Use volume pressure as a confirming tool alongside price action or trend-based systems
It helps determine when large buying/selling activity is occurring and whether such behavior is consistent across timeframes—a strong signal of institutional interest or volume-driven trend shifts.
🧩 Key Features & Logic
Real-Time Table Display: A clean, dynamic table showing:
Buy Volume
Sell Volume
Total Volume
Buy % of total volume
Sell % of total volume
Multi-Time frame Analysis: Supports 8 user-selectable custom time frames from 1 to 240 minutes, giving flexibility to analyze volume pressure at various granularities.
Color-Coded Volume Bias:
Green for dominant Buy pressure
Red for dominant Sell pressure
Yellow for Neutral
Intensity-based blinking for extreme values (over 70%)
Dynamic Data Calculation:
Uses volume * (close > open) logic to estimate buy vs sell volumes bar-by-bar, then aggregates by timeframe.
⚙️ User Inputs & Settings
Timeframe Selectors (TF1 to TF8): Choose any 8 timeframes you want to monitor volume pressure across.
Text & Color Settings:
Customize text colors for Buy, Sell, Total volumes
Choose Buy/Sell bias colors
Enable/disable blinking for visual emphasis on extremes
Table Appearance:
Set header color, metric background, and text size
Table positioning: top-right, bottom-right, etc.
Blinking Highlight Toggle: Enable this to visually highlight when Buy/Sell % exceeds 70%—a sign of strong pressure.
📊 Visual Elements Explained
The table has 6 rows and 10 columns:
Row 0: Headers for Today and TF1 to TF8
Rows 1–3: Absolute values (Buy Vol, Sell Vol, Total Vol)
Rows 4–5: Relative percentages (Buy %, Sell %), with dynamic background color
First column shows the metric names (e.g., “Buy Vol”)
Cells blink using alternate background colors if volume pressure crosses thresholds
💡 How to Use It Effectively
Use Buy/Sell % rows to confirm potential breakout trades or identify volume exhaustion zones
Look for multi-timeframe confluence: If 5 or more TFs show >70% Buy pressure, buyers are in control
Combine with price action (e.g., breakouts, reversals) to increase conviction
Suitable for equities, indices, futures, crypto, especially on lower timeframes (1m to 15m)
🏆 What Makes It Unique
Table-based MTF Volume Pressure Display: Most indicators only show volume as bars or histograms; this script summarizes and color-codes volume bias across timeframes in a tabular format.
Customization-friendly: Full control over colors, themes, and timeframes
Blinking Alerts: Rare visual feature to capture user attention during extreme pressure
Designed with performance and readability in mind—even for fast-paced scalping environments.
🚨 Alerts / Extras
While this script doesn’t include TradingView alert functions directly, the visual blinking serves as a strong real-time alert mechanism.
Future versions may include built-in alert conditions for buy/sell bias thresholds.
🔬 Technical Concepts Used
Volume Dissection using close > open logic (to estimate buyer vs seller pressure)
Simple aggregation of volume over custom timeframes
Table plotting using Pine Script table.new, table.cell
Dynamic color logic for bias identification
Custom blinking logic using na(bar_index % 2 == 0 ? colorA : colorB)
⚠️ Disclaimer
This indicator is a tool for analysis, not financial advice. Always backtest and validate strategies before using any indicator for live trading. Past performance is not indicative of future results. Use at your own risk and apply proper risk management.
✍️ Author & Signature
Indicator Name: Volume Pressure
Author: GSK-VIZAG-AP-INDIA
TradingView Username: prowelltraders

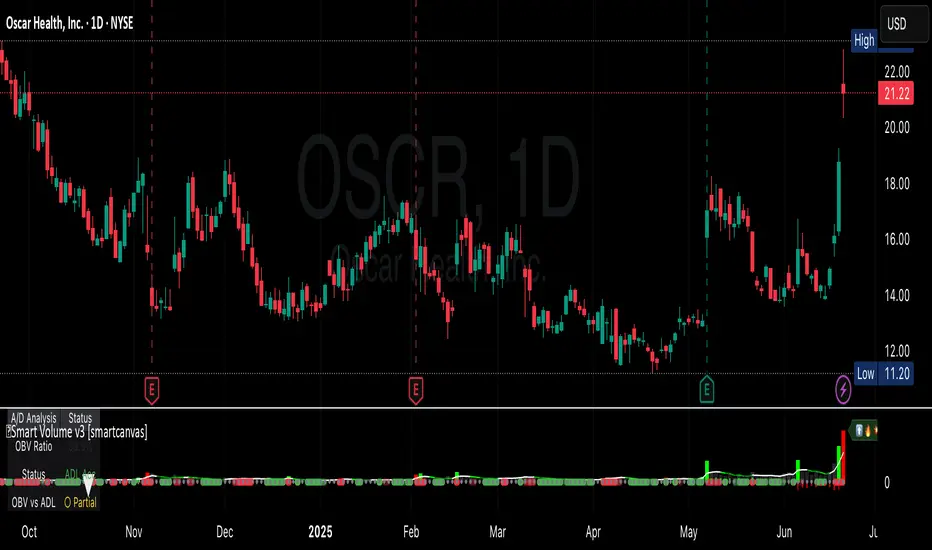
Smart VolumeThis script introduces a unique approach to volume analysis by combining three critical components that work together to identify institutional activity:
1. Adaptive Volume Analysis
- Automatically calculates significant volume thresholds specific to each stock (current bar volume compared to the average of previous 6 bars)
- Unlike standard indicators using fixed multipliers (like 2x average volume), this adapts to each stock's unique trading characteristics
- Example: A 2x volume spike might be significant for AAPL but irrelevant for a volatile small-cap
2. Volume Contraction Pattern (VCP) Detection
- Identifies periods of decreasing volume with precise criteria:
• Requires 6+ consecutive periods of declining volume
• Volume must compress by at least 20% from peak
• Price must remain within a defined channel
- Automatically detects completion of compression patterns
3. RVM (Relative Volatility Measure) Integration
- Measures current volatility against historical averages
- Identifies low-volatility periods that often precede major moves
- When combined with volume compression, signals higher probability setups
How Components Work Together:
- Volume spikes are evaluated against stock-specific thresholds
- VCP detection runs continuously to identify compression patterns
- RVM confirms volatility contraction aligned with volume compression
- When all three align, the indicator signals potential breakout entry
Usage:
1. Monitor volume bars for spikes above adaptive thresholds (bright green/red)|
2. Monitor average volume line turning from white to green indicating volume contraction (the brighter the green the more contraction happened)
2. Watch for green shading at the zero-line indicating volatility compression (RVM)
3. Use the statistics table for more insights
Original Features:
- First indicator to combine adaptive volume thresholds with VCP detection
- Implements stock-specific volume analysis instead of fixed multipliers
- Integrates volatility confirmation with volume patterns
- Provides real-time statistical analysis of compression patterns
Best suited for daily timeframes on liquid stocks where institutional activity is most visible.
Note: While patterns suggest potential moves, always confirm with price action before trading.
Video:
1. [Pufferman] - Comprehensive VolumeThis indicator presents a comprehensive approach to volume analysis, incorporating several key metrics to provide traders with a detailed view of market activity. Here's what's included:
1. Cumulative Relative Volume (Intraday): This metric accumulates volume data throughout the day, comparing it to historical session averages up to the current time. It's particularly useful for intraday analysis to determine if the stock is trading high or low volume before the day is over.
2. Real Relative Volume - This feature calculates the relative volume of a stock in comparison to the SPY, offering insight into whether a stock is trading with higher relative volume than the broader market.
3. Configurable Moving Average for Volume: Users can adjust the moving average period for average volume, allowing for flexible adaptation to different trading strategies and time frames. (green line in photo)
4. Above/Below Average Line: This line indicates whether the current volume bar exceeds or falls short of the session's average volume, providing immediate context for volume analysis. (red line in photo).
5. Volume Display in Abbreviations: Actual volume figures are presented in an abbreviated format, using "K" for thousands and "M" for millions, facilitating quick and easy analysis.
6. Color-Coded Relative and Real Relative Volume: Both the Relative Volume (RVOL) and Real Relative Volume (RRVOL) are color-coded to instantly convey volume concentration levels, enhancing visual analysis across multiple charts.
7. Volume Bars with Bullish and Bearish Highlights: Traditional volume bars are color-highlighted according to corresponding candle patterns, aiding in the identification of market sentiment.
Key Points:
The RVOL is a cumulative metric, considering time-of-day volume comparisons for intraday analysis. This approach offers a nuanced understanding of volume patterns specific to the timeframe being viewed.
The RRVOL provides a comparative analysis against the market, offering insights into stock-specific volume activity relative to market trends.
Note: This indicator is designed for intraday analysis and may not function as intended on timeframes above daily due to the cumulative nature of its volume calculations.

HTF Volume by Prosum SolutionsOverview of Features
This indicator was inspired by the work of "LonesomeTheBlue" in the script called "Volume Multi Time Frame" . This script will provide a highly customizable interface to specify the higher timeframe period for the volume with the ability to link to the "HTF Candles by Prosum Solutions" indicator using the "HTF Setting Code" data point, as well as adjusting various styling options for the volume bar color fill and border.
Usage Information
The indicator can be applied to any chart at any time frame. When the "Chart" option is chosen for the "Timeframe" field, the indicator will attempt to find a higher timeframe resolution to ensure the volume bars are drawn. The indicator will simply accumulate the volume value for each candlestick bar and reset when the new high timeframe period has started. The color of the volume bars are relative to the higher timeframe setting so that you can visually interpret when the volume in a rising or falling state relative to the higher timeframe price action.
If you choose to add the "HTF Candles by Prosum Solutions" indicator, you can link this indicator to it by choosing the "HTF Candles" option for the "Timeframe Source" field and then choosing the "HTF Setting Code" option for the "HTF Candles" field. At this point, whenever you adjust the high timeframe setting in the "HTF Candles by Prosum Solutions" indicator, this indicator will automatically adjust the timeframe to match it, thereby reducing the steps you need to take to keep the two indicators in sync.
Enjoy! 👍

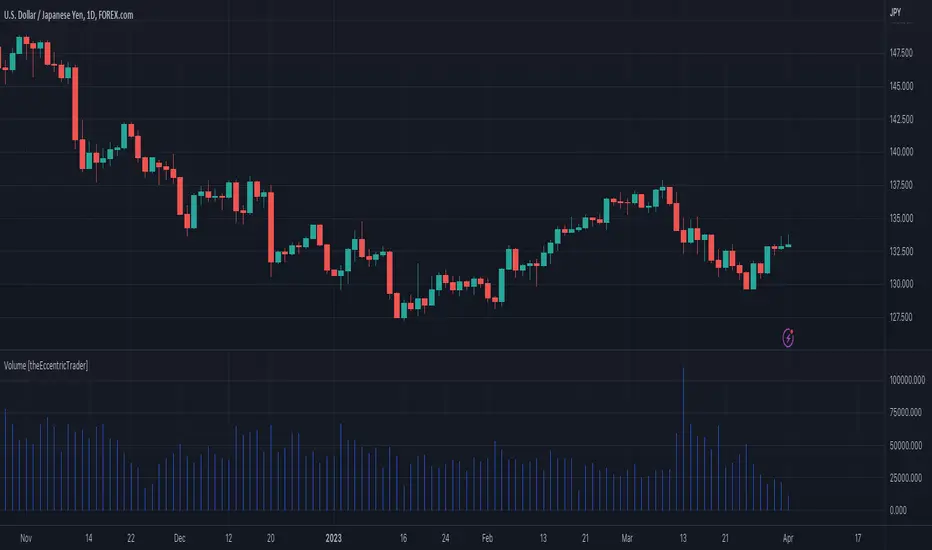
Volume [theEccentricTrader]OVERVIEW
This indicator simply bridges the gap between symbols from brokers that provide volume data and symbols from brokers that do not provide volume data. Users can select any symbol that provides volume data from the settings menu and the volume data will be displayed in histogram form on their current chart. The default volume symbol is CURRENCYCOM:US500.
CONCEPTS
Volume
Volume refers to the total number of shares or contracts that are traded during a given period of time. It is a measure of the amount of activity in the market and can be used to gauge the strength or weakness of a particular trend.
Volume is typically displayed as a histogram on trading charts, with each bar representing the total volume for a particular time period. High volume bars indicate a lot of trading activity, while low volume bars indicate relatively little trading activity.
Traders use volume in a number of ways. For example, they may use it to confirm a trend. If a stock is trending up and the volume is also increasing, this can be seen as a sign that the trend is strong and likely to continue. Conversely, if a stock is trending down and the volume is also increasing, this can be seen as a sign that the trend is weak and may be coming to an end. Volume can similarly be used to identify potential reversals. If a stock is trending up but the volume starts to decrease, this could indicate that the trend is losing momentum and that a reversal may be imminent.
FEATURES
Inputs
• Volume Symbol
Style
Users can change plot color and style from the default Style menu if so required.
NOTES
For 24-hour markets and forex volume I use the broker currency.com. As can be seen in the example above, I am using CURRENCYCOM:USDJPY to pull volume to a FOREXCOM:USDJPY chart, which otherwise would not show volume data as forex.com do not provide it.
Volume [Educational]Hello All,
This is an educational work and it's developed to show how to write scripts that will work like built-in volume indicator.
We have new features in Pine Script™ Language, such chart.bg_color, chart.fg_color, chart.left_visible_bar_time, chart.right_visible_bar_time and many more. Many Thanks to Tradingview and Pine Team for such great additions!
You can find more information about these new functions here .
How the script works?
- At the first step it calculates how many visible bar on the chart by using chart.right_visible_bar_time and chart.left_visible_bar_time functions.
- Calculates the zero line for the volume
- Finds maximum volume on visible area and normalize all volume values
- Draws volume bars
- Shows volume info as indicator value. in this step it uses chart.fg_color and plotarrow() commands to show the values in optimum color.
In order to place the indicator at the bottom of the chart, Please set Bottom Margin = 0 as shown in the following screenshot:
You can change the volume bar colors optionally.
An Example screenshot with different volume bar colors:
Enjoy!

Current bar predicted volumeDrag this indicator in the same panel with the volume in the object tree, then right click on the scale bar and set "merge all scale into one" for a correct visualization.
This indicator multiply the current traded volume of a candle with the total time of that candle. This offer a prediction of where, in case the volumes would keep trading at a comparable magnitude, the volume bar would close when the candle will close.
The predicted volume is indicated with a blue short line above the current volume bar, and updates in real time.
I find this indicator extremely useful to offer at a glance an idea of an ascending or descending volume pattern, that can serve as confirmation for a reversal or breakout for example.
Very suitable for short time frames, where decisions have to be taken fast.
Enjoy,
Luca.

Balihuntul Normalized Absolute Volume by RRBBalihuntul Normalized Absolute Volume by RagingRocketBull 2018
Version 1.0
This indicator shows absolute and/or normalized volume for an asset, allows for more accurate volume based comparisons (like a log scale for volume).
Volume is measured in coins traded, not USD traded, so direct comparisons of different price moves may not be accurate.
Professional traders usually compare absolute or normalized volumes of trend moves/spikes/dips/capitulation events instead.
When the USD price of an asset is lower you can trade more coins but capitalization won't be as significant as when there are less coins for a higher price.
Similarly, you can normalize volume using:
- price/price ma (to get a bit of a price-weighted volume) or
- volume ma to compare it with its average assuming the total volume is a percentage above or below the MA (100% or 1).
- use alpha multiplier to add/lose a few zeroes if necessary
Features:
- Use Absolute Price Value (Price * Volume) of an asset instead of Coins Traded (Volume) to compare capitalization
- Normalize volume using Price / Price MA / Volume MA
- Supports any existing type of MA: SMA, EMA, WMA, HMA etc
- Oscillator mode with negative axis
- Highlight high volume spikes above MA or hide low volume bars below MA
- Change color based on prev Close or Volume bars
- Change Volume MA color based on a number of last rising/falling bars
- Display volume as 1000s, mlns, or blns using alpha multiplier
Notes:
1. uses plot* and custom hma functions
2. swma has a fixed length = 4, alma and linreg have additional offset and smoothing params
Feel free to use. Good Luck!

Volume profilerMulti-Range Volume Analysis & Absorption Detection
This tool visualises market activity through multi-range volume profiling and absorption signal detection. It helps you quickly identify where volume expands, compresses, or diverges from expected behaviour.
What it does
Volume Profiler plots four volume EMAs (short / mid / long / longer) so you can gauge how current volume compares to different market regimes.
It also highlights structural volume extremes:
• Low-volume bars (liquidity withdrawal)
These are potential signs of exhaustion, pauses, or low liquidity environments.
• High-volume + Low-range absorption
A classic footprint-style signal where aggressive volume fails to move price.
Often seen during:
absorption of one side of the book
liquidity collection
failed breakouts
institutional accumulation/distribution
You can choose:
which EMA defines “high volume”
how to measure candle range (High-Low, True Range, or Body)
how to define baseline volatility (ATR or average range)
Alerts are included so you can monitor absorption automatically.
Features
Multi-range volume EMAs (10 / 50 / 100 / 300 by default)
Low-volume bar flags
Absorption detection based on custom thresholds
Customisable volatility baseline
Optional bar colouring
Labels displayed directly in the volume pane
Alert conditions for absorption events
How to use
This indicator is valuable for:
confirming trend strength or weakness
detecting absorption before reversal or breakout continuation
finding low-liquidity pauses
identifying volume expansion across different time horizons
footprint-style behavioural confirmation without needing order-flow data
Works across all markets and timeframes.
Notes
This script is intended for educational and analytical use.
It does not repaint.

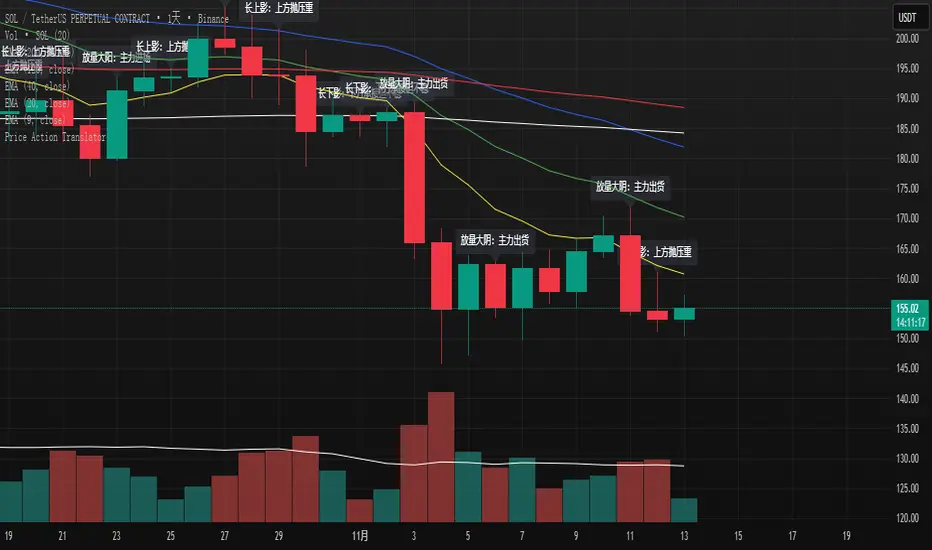
K线语言·国师版 — Price Action TranslatorUnderstand what the market is really saying.
This script automatically translates candlestick and volume behavior into clear, human-readable messages directly on your chart.
Instead of guessing what each bar means, you can hear the market speak.
📈 Green bar with volume → Buyers are in control
📉 Red bar with volume → Sellers are dumping positions
⚖️ Doji → Indecision between buyers and sellers
💡 Long upper wick → Selling pressure from above / Long lower wick → Buyers absorbing below
🧠 Core Concept
Most indicators tell you what happened.
Price Action tells you why it happened.
This script bridges that gap by letting the candles explain the psychology behind every move.
It helps traders:
Visualize market sentiment through candlestick language.
Identify institutional accumulation or distribution.
Build confidence by understanding the story behind price.
⚙️ Main Features
✅ Automatically detects strong volume bars, Doji, long wicks, and reversal patterns.
✅ Displays short contextual messages above or below each bar.
✅ Works on all time frames (Daily / 4H / 1H).
✅ Clean and non-intrusive visual design.
📈 Best For
Traders learning Price Action logic.
Multi-time-frame trend analysts.
Active traders who want to reduce emotional decisions.
🚀 Usage Tips
1️⃣ Use it with your EMA trend system for confirmation.
2️⃣ Watch for volume surges to confirm real momentum.
3️⃣ Do not chase small Doji bars — wait for confirmation candles.
💬 Author’s Note
“Price Action is the language of the market.
Once you understand its voice, you don’t need to guess anymore.”
— Master Edition · Price Action Translator
Z-Score Volume with CVD Clustering Script Title:
Z-Score Volume with CVD Clustering & NY VWAP
📘 Description:
This indicator combines statistical volume analysis with order flow confirmation to detect high-probability trade zones and volume-based divergences.
📌 Components:
Z-Score of Volume: Identifies statistically significant volume surges or drops relative to a moving average baseline.
Cumulative Volume Delta (CVD): Gauges net buying vs. selling pressure using high-frequency bid/ask delta.
K-Means Clustering: Applies clustering logic to classify each bar into:
Cluster 2 – Strong Bullish: Z-Score and CVD both strong
Cluster 1 – Divergence / Bull Trap: Z-Score high, but weak CVD
Cluster 0 – Neutral / Noise: No clear alignment
Anchored VWAP (NY Session Open): Confirms market structure and institutional trend bias from 9:30 AM ET forward.
🎯 Suggested Applications:
✅ 1. Trend Continuation Entries (Add-ons):
Look to add to positions when:
Cluster 2 signal occurs
Price is above the NY session VWAP
Price structure has broken out of prior day high/low or range
⚠️ 2. Divergence Detection (Fade Traps):
Cluster 1 signals a bearish divergence (e.g., high volume but weak CVD).
Especially useful when price is failing to stay above VWAP.
Useful for early exits or reversal setups.
📊 3. Volume Profile Confirmation:
Combine with fixed or session-based volume profile tools.
Use Z-Score clusters to confirm volume spikes into low-volume nodes (LVNs) or during imbalance transitions.
📍 4. VWAP Structure Confirmation:
Anchored VWAP acts as a dynamic reference point.
Helps confirm acceptance vs. rejection zones at key institutional levels.
📈 Visuals & Alerts:
Color-coded volume bars show intensity of Z-Score & CVD confluence
CVD Line plots real-time delta bias with green/red coloring
Cluster-based shape markers highlight key bars for actionable signals
Optional: Add alerts for Cluster 2 above VWAP or Cluster 1 below VWAP
⚙️ Customization Options:
Adjustable Z-Score length
Custom anchor timeframe for CVD (e.g., 1D or sessions)
Adjustable max lookback depth
Toggle VWAP inclusion
Extendable to include additional filters: RSI, structure break alerts, etc.
🔧 Ideal Use Cases:
NY session intraday traders (ES, NQ, CL, 6E, FX pairs)
Breakout traders wanting order flow confirmation
Mean reversion traders spotting fake moves
Volume-based scalpers looking for edge on short-term order imbalance
